
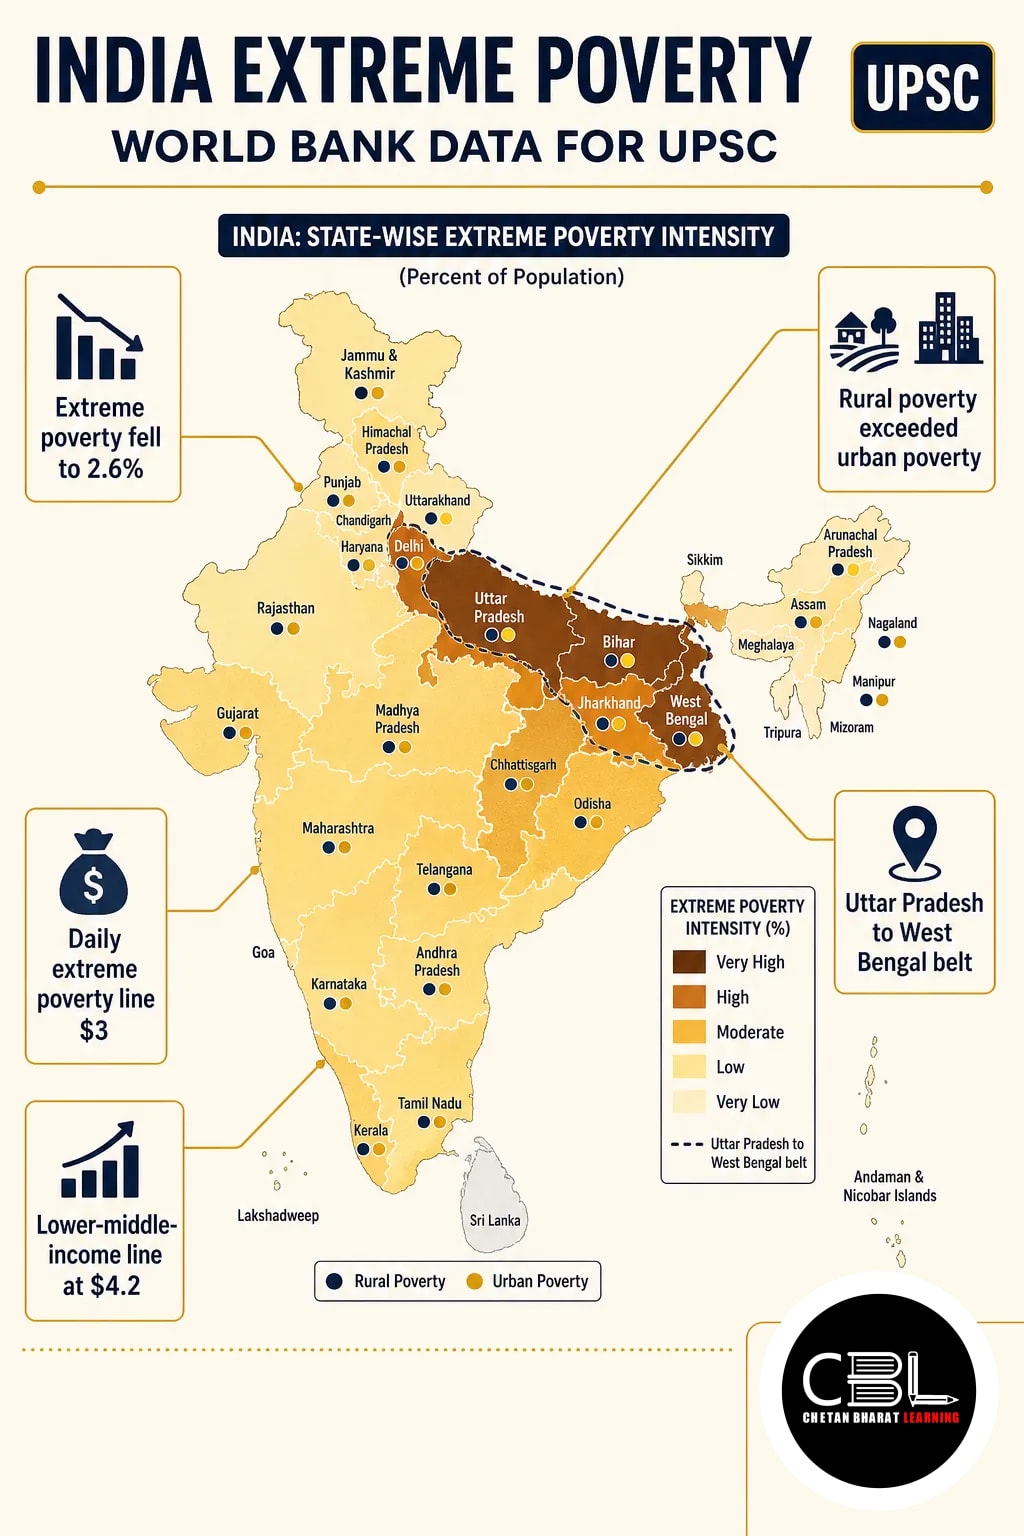
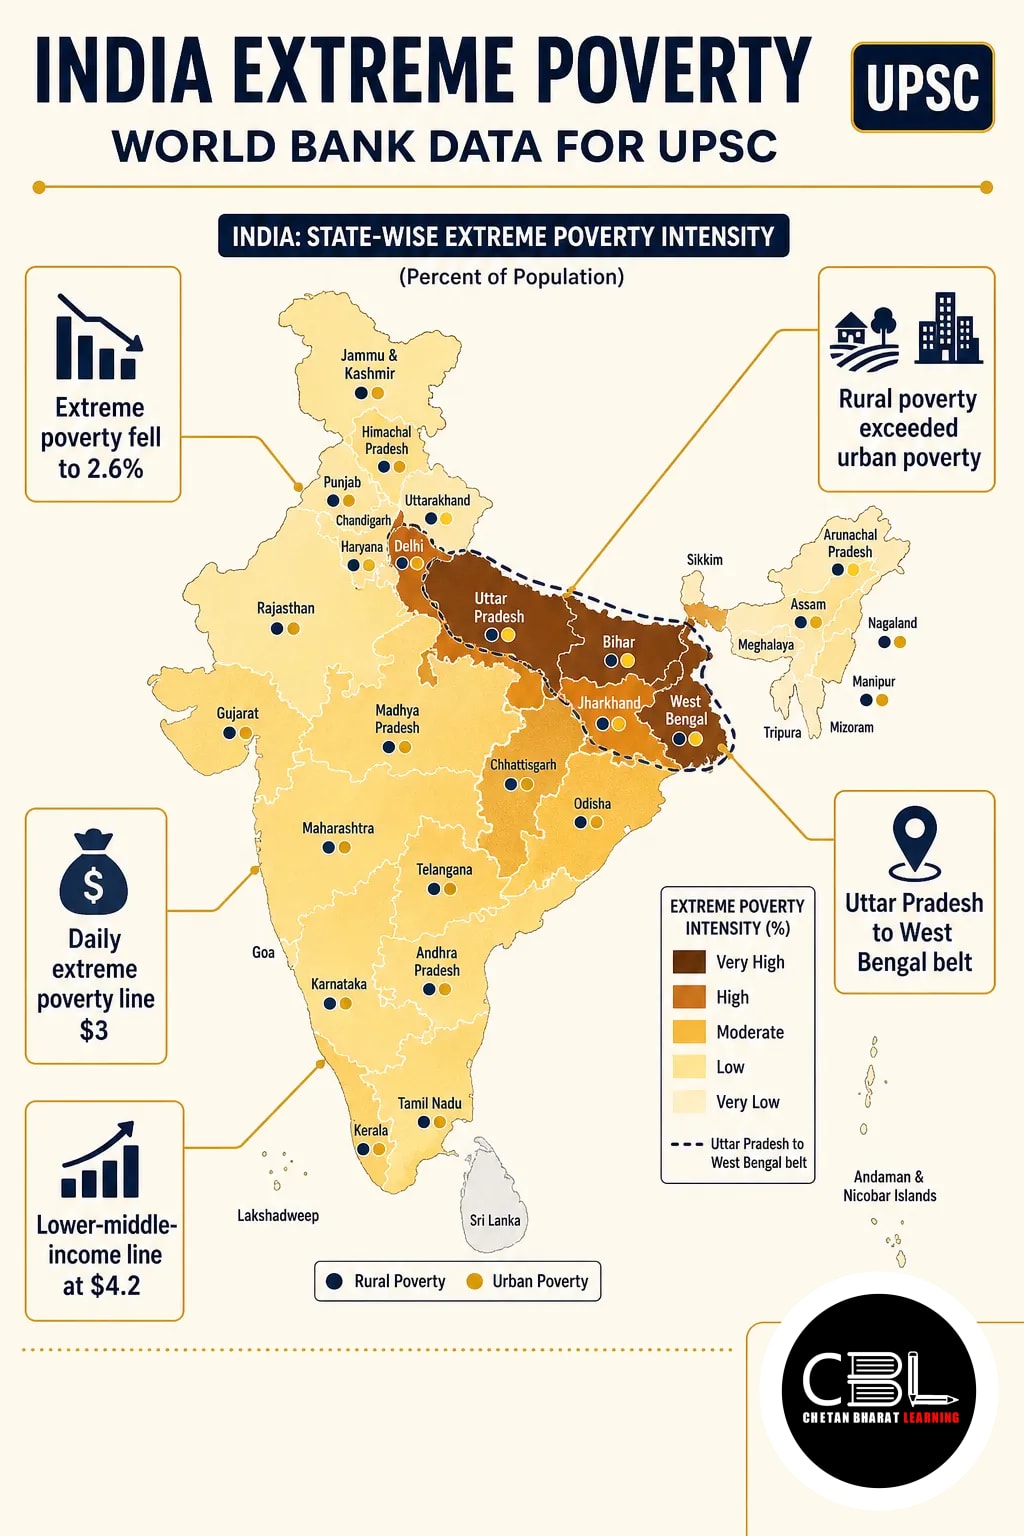
India extreme poverty fell to 2.6% in 2023, according to the World Bank’s latest data. The finding is significant for Indian economy and inclusive growth, although higher poverty thresholds reveal continuing vulnerability.
Quick answer: The World Bank estimates India extreme poverty at 2.6% in 2023, using a $3 daily threshold in 2021 purchasing power parity terms. This compares with 5.3% in 2022-23. However, at the $4.2 threshold, 16.1% remained below the poverty line in 2023.
What are the World Bank’s key findings?
The Bank’s estimates show a steep decline in poverty, but outcomes differ considerably across thresholds and locations. The table retains the years and survey-period labels used in the source.
| Indicator | India’s estimate |
|---|---|
| Below $3 a day | 27.1% in 2011; 5.3% in 2022-23; 2.6% in 2023 |
| Below $4.2 a day | 57.7% in 2011; 23.9% in 2022-23; 16.1% in 2023 |
| Below $8.3 a day | Over 90% in 2011; 80% in 2023 |
| Consumption Gini index | 28.8 in 2011-12; 25.5 in 2022-23; 23.0 in 2023 |
At the $4.2 lower-middle-income poverty line, the Bank estimates that 496 million people moved out of poverty between 2011 and 2023. However, the 2023 shares were 19.3% in rural areas and 8.6% in urban areas.
At the same threshold, the estimated shares were 15.7% for males and 16.6% for females. Moreover, about 57% of India’s poor live in a belt stretching from Uttar Pradesh to West Bengal.
What does the Poverty & Equity Brief measure?
The World Bank’s Poverty & Equity Brief assesses poverty and inequality using household consumption data and international poverty lines. Its estimates draw on Indian household consumption expenditure surveys for 2011-12, 2022-23 and 2023-24.
The $3 extreme poverty line uses 2021 purchasing power parity (PPP). PPP compares the purchasing power of currencies by accounting for differences in price levels across countries.
Consequently, the threshold is not converted into rupees using the market exchange rate alone. The Bank also uses $4.2 and $8.3 daily lines for lower-middle-income and upper-middle-income country comparisons, respectively.
These are distinct international benchmarks, so crossing the lowest line does not necessarily imply economic security. For a related discussion of food costs, see CBL’s article on measuring the cost of a thali.
Why has poverty declined while inequality remains a concern?
Lower poverty rates coincide with employment growth, but the quality and distribution of work remain important. The Bank estimates that employment rose by 13.4 crore between 2017 and 2023, driven by rural women entering paid work.
However, real earnings remained broadly unchanged, and employment growth concentrated in relatively low-productivity activities. Median earnings among the top 10% of workers were about 13 times those among the bottom 10%.
The consumption Gini index fell to 23.0 in 2023; its scale runs from 0 to 100, with higher values indicating greater inequality. However, consumption inequality and earnings disparity measure different things, so their movements need not match.
In addition, the Bank cautions that surveys may not fully capture wealthier households’ consumption. The resulting Gini estimates may therefore understate inequality.
What gaps matter for policy?
The headline decline leaves several gaps relevant to inclusive growth and public policy.
- Geographical concentration: The Uttar Pradesh–West Bengal belt accounts for about 57% of India’s poor, making location-sensitive interventions important.
- Rural disadvantage: At the $4.2 line, the rural poverty rate exceeds the urban rate by 10.7 percentage points.
- Employment quality: More jobs have not necessarily produced higher real earnings; therefore, productivity and pay deserve attention alongside job numbers.
- Young workers: Youth unemployment rose from 14.6% in the first quarter of 2025-26 to 15.9% in the corresponding quarter of 2026-27.
- Measurement limits: Survey coverage and revisions can change estimates; consequently, comparisons need consistent thresholds, prices and periods.
The Bank projects poverty at the $4.2 line to decline to 14.2% in 2026 and 12.1% by 2028. However, these are projections, not survey findings, and the Bank will update them as data change.
What should India prioritise?
India should combine geographically targeted poverty reduction with better employment quality and stronger measurement.
- Target local deprivation: Use state and district evidence to identify underserved areas; meanwhile, retain support for vulnerable households elsewhere.
- Improve livelihoods: Focus on productive employment and skills, especially for young workers and rural women.
- Protect against setbacks: Link livelihood measures with accessible social protection; see CBL’s analysis of social security coverage in India.
- Strengthen evidence: Improve survey coverage and publish comparable data; in addition, track outcomes beyond the lowest monetary threshold.
Overall, reducing extreme poverty is an important achievement, but durable inclusion also requires better earnings, lower disparities and protection against shocks.
Source: The Indian Express, 31 October 2026
- India Needs a Thali Index (18 Jul 2025)
Asked in UPSC: Previous Year Questions
- UPSC CSE Prelims 2019 (GS Paper I): Why are official poverty lines higher in some Indian states than in others?
UPSC tests how price differences affect poverty measurement; therefore, distinguish domestic poverty lines from international PPP benchmarks.
Punjab PCS and Haryana HCS can test poverty measurement, price differences and rural–urban disparities in General Studies. Additionally, candidates can discuss how state governments use local evidence to target livelihood and social protection measures.
Prelims Practice Corner
Mains Practice Questions
Frequently Asked Questions
What was India’s extreme poverty rate in 2023?
It was 2.6%, according to the World Bank. The estimate uses a daily threshold of $3 in 2021 PPP terms.
What does purchasing power parity mean for poverty estimates?
PPP adjusts currency comparisons for differences in price levels. Therefore, it differs from simply converting a poverty line at the market exchange rate.
Does low extreme poverty mean inequality has disappeared?
No, because the Bank also identified substantial earnings disparities. Moreover, it cautioned that consumption surveys may understate inequality.
Related Current Affairs
Preparing for UPSC, PCS or HCS?
Talk to a mentor at Chetan Bharat Learning, Chandigarh. Free guidance on choosing the right exam and building a study plan.
Chat on WhatsAppCall 97793 53345UPSC / IAS / PCS coaching in Chandigarh · Trusted by aspirants across Punjab & Haryana






Leave a Reply
You must be logged in to post a comment.