

UPSC Mapping
| Prelims | Environment, Economy and Government Initiatives |
|---|---|
| Mains | GS Paper III — Environment, Infrastructure and Economy |
Quick Facts
| Edition | Second Edition |
|---|---|
| Developed By | NITI Aayog and WRI India |
| Coverage | 36 States and UTs |
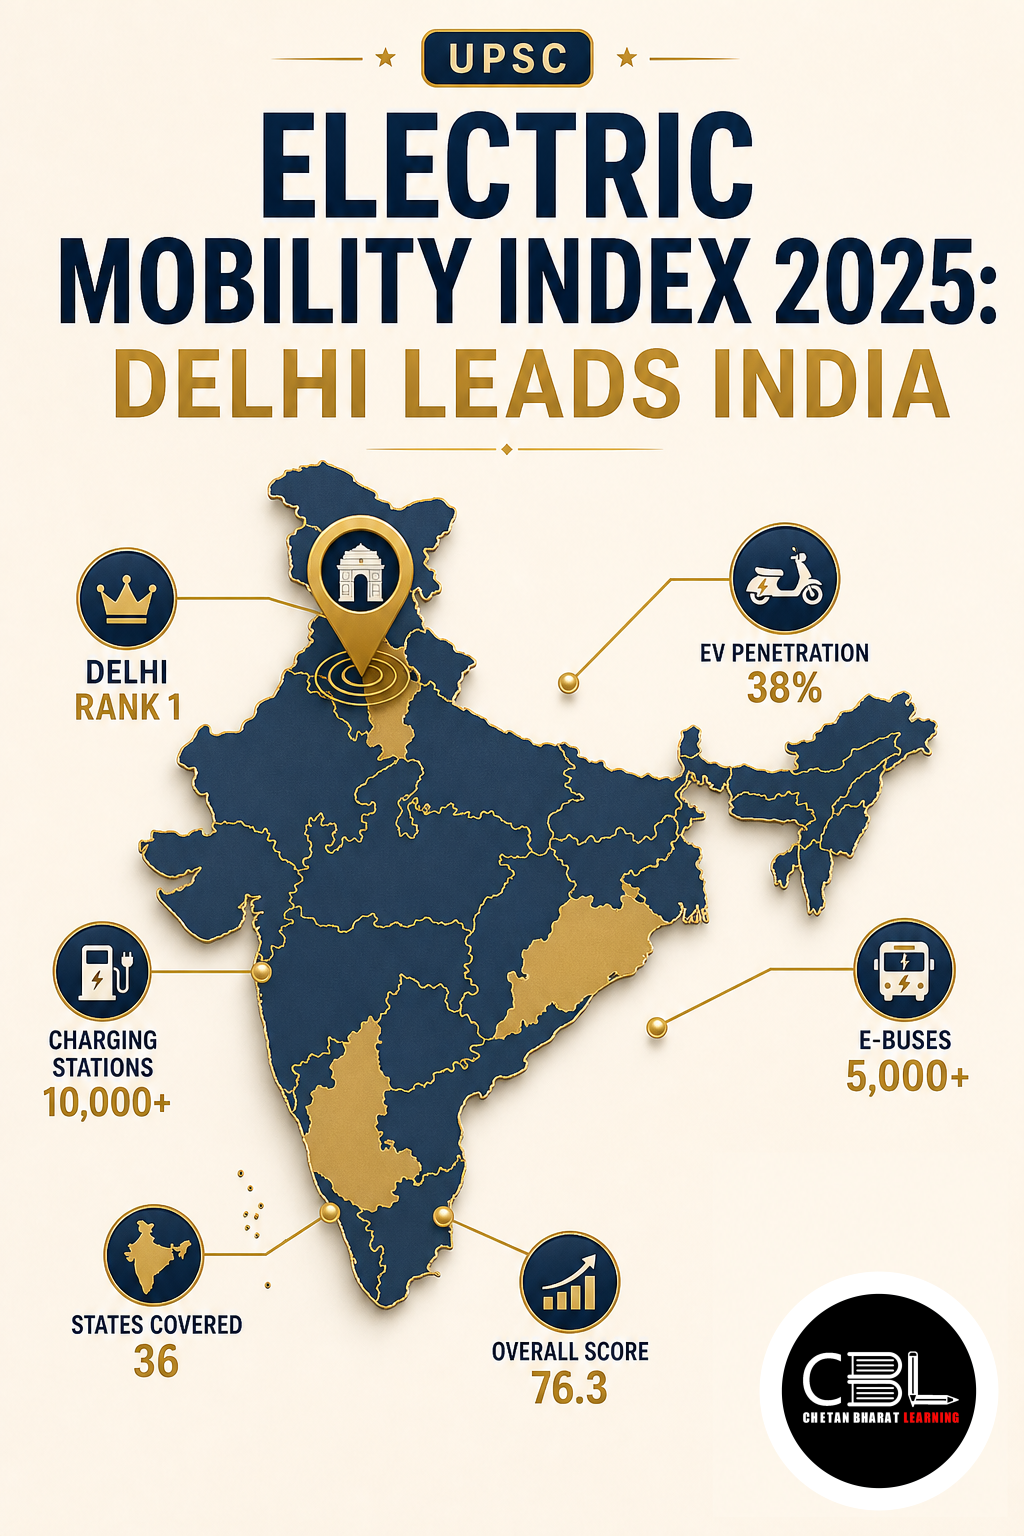
| National Leader | Delhi — Score 84 |
What is the Electric Mobility Index?
The Electric Mobility Index is a composite framework for assessing electric-mobility performance at the subnational level. It examines both the policy framework created by a jurisdiction and the outcomes produced through implementation. NITI Aayog developed it with WRI India to recognise strong performers, identify decisive success factors and encourage evidence-based action. The index also enables States and Union Territories to compare their progress with suitable peers.
The 2025 edition evaluates progress achieved between January and December 2025. It uses 16 indicators divided between outcome indicators and enabling conditions such as policies, institutions and infrastructure. Scores range from zero to 100 at the indicator, theme and overall levels. Jurisdictions scoring at least 65 qualify as Top Performers, while scores of 50–64 indicate Frontrunners. Emerging Performers score 35–49, whereas jurisdictions below 35 enter the Aspirants category. This classification makes performance gaps easier to understand without reducing the assessment to rank alone.
Why is the Electric Mobility Index in News?
NITI Aayog released the second edition in September 2026, recording Delhi’s national-leading score of 84. Maharashtra ranked second with 78, Karnataka third with 73, Chandigarh fourth with 71 and Goa fifth with 65. These five jurisdictions entered the Top Performer category. The Electric Mobility Index 2025 reported an overall score range of 10–84 and a national median of 40. The official NITI Aayog report provides the complete methodology, jurisdiction profiles and indicator-level results.
Delhi and Maharashtra retained their first and second positions from the previous edition. Karnataka moved ahead of Chandigarh, while Goa climbed ten positions to enter the top five. Madhya Pradesh registered the largest improvement, advancing from twenty-third to seventh position and increasing its score from 31 to 59. The national top score rose from 77 to 84, while the median increased from 36 to 40. These gains indicate wider progress, yet major differences remain between metropolitan regions, industrialised states and geographically dispersed territories.
Key Features
- Transport electrification: This theme carries 50% weightage and measures EV uptake, consumer acceptance, policy incentives, governance initiatives and support for the electrification of private and commercial vehicle segments.
- Charging readiness: Carrying 30% weightage, this theme evaluates charger availability, capital support, charging-related building regulations, power reliability and broader conditions required for accessible public infrastructure.
- Research and innovation: This theme receives 20% weightage and examines EV start-ups, research initiatives and patents, thereby measuring whether a jurisdiction can support long-term technological development.
- Context-sensitive peer groups: The 2025 methodology separately groups Large States, Hilly and Northeastern States, and UTs and City States to reduce distortions created by different geographical, demographic and administrative conditions.
- Annual evidence-based assessment: The index uses government platforms, dashboards and open datasets, while periodic updates allow policymakers to monitor implementation, compare performance and adopt practices demonstrated by stronger jurisdictions.
Challenges
- Weak electrification outcomes: Transport Electrification Progress remained the largest improvement opportunity because only Delhi, Chandigarh and Maharashtra qualified as Top Performers, while 14 jurisdictions entered the Aspirants category.
- Infrastructure-adoption mismatch: Some states developed charging networks faster than vehicle adoption, while others experienced rising registrations without proportional charger deployment, creating underutilised assets in one region and range anxiety in another.
- Geographical constraints: Dispersed settlements, difficult terrain and smaller vehicle markets raise the cost of charging networks in Hilly, Northeastern, island and frontier regions, limiting the commercial case for private investment.
- Concentrated innovation capacity: Research institutions, EV start-ups and patent activity remain clustered around industrial and metropolitan centres, leaving several jurisdictions without a measurable innovation ecosystem or specialised technical workforce.
- Implementation gaps: Policy notification does not guarantee charger installation, subsidy delivery, reliable electricity supply or fleet conversion, making administrative capacity and coordination increasingly important. Aspirants can track connected policy measures through Chetan Bharat Learning’s environment current affairs coverage.
Way Forward
States must move from policy announcements towards measurable implementation. They should map charging demand, simplify approvals, enforce charging provisions in building regulations and involve electricity distribution companies in network planning. Public support should prioritise underserved locations and high-usage segments such as buses, commercial three-wheelers and urban delivery vehicles. Governments should also strengthen battery safety, recycling systems, technical skills and renewable-powered charging. Such measures can align fleet conversion with infrastructure expansion instead of treating them as separate policy tracks.
The Electric Mobility Index can become a stronger instrument of competitive federalism through comparable annual data, independent evaluation and systematic sharing of successful state practices. Policymakers should interpret overall rankings with theme-level scores because similar totals can conceal different strengths and weaknesses. The national transition must also account for affordability, grid capacity, domestic manufacturing and regional mobility patterns. A PIB release on the index highlights electric mobility as an economic, environmental and strategic priority. Balanced implementation can reduce oil dependence, improve urban air quality and support India’s long-term decarbonisation objectives.
Prelims Practice Corner
Q1. The India Electric Mobility Index 2025 was developed by NITI Aayog in collaboration with which organisation?
- a) International Energy Agency
- b) WRI India
- c) Bureau of Indian Standards
- d) International Solar Alliance
Answer: (b) NITI Aayog developed the composite index in collaboration with WRI India.
Q2. Which jurisdiction secured the highest overall score in the 2025 edition?
- a) Maharashtra
- b) Karnataka
- c) Delhi
- d) Chandigarh
Answer: (c) Delhi ranked first nationally with an overall score of 84.
Q3. Consider the following themes: 1. Transport Electrification Progress 2. Charging Infrastructure Readiness 3. EV Research and Innovation Status. Which of these form part of the index?
- a) 1 only
- b) 1 and 2 only
- c) 2 and 3 only
- d) 1, 2 and 3
Answer: (d) The framework evaluates performance through all three themes and their 16 indicators.
Q4. Which theme carries the highest weightage in the index?
- a) Charging Infrastructure Readiness
- b) Transport Electrification Progress
- c) EV Research and Innovation
- d) Battery Recycling Capacity
Answer: (b) Transport Electrification Progress carries 50% weightage.
Q5. With reference to the 2025 findings, consider the following statements: 1. Karnataka recorded the highest Charging Infrastructure Readiness score. 2. Delhi recorded the highest EV Research and Innovation Status score. 3. Madhya Pradesh moved from twenty-third to seventh position. How many statements are correct?
- a) Only one
- b) Only two
- c) All three
- d) None
Answer: (c) Karnataka scored 97 in charging readiness, Delhi scored 94 in research and innovation, and Madhya Pradesh rose to seventh position.
Mains Practice Questions
Q1. Explain how a state-level electric-mobility assessment can promote competitive federalism and evidence-based policymaking in India. (10 marks)
Intro: Define the index as a comparative framework covering EV adoption, infrastructure and innovation.
Body: Discuss benchmarking, peer learning, transparent rankings, identification of policy gaps and replication of effective state practices.
Conclusion: Emphasise comparable data and implementation-focused cooperation among States and Union Territories.
Q2. India’s electric-vehicle transition is advancing, but adoption, charging infrastructure and innovation are progressing at different speeds. Examine. (15 marks)
Intro: Present electric mobility as an energy-security, economic and decarbonisation pathway.
Body: Cover regional disparities, infrastructure-adoption mismatch, concentrated innovation, implementation gaps, affordability, grid readiness and suitable mobility segments.
Conclusion: Recommend synchronised fleet electrification, charging deployment, domestic innovation and inclusive regional planning.
FAQs on the Electric Mobility Index
What does the India Electric Mobility Index measure?
It measures state and UT performance in transport electrification, charging readiness, and EV research and innovation. It considers both implementation outcomes and enabling policy conditions.
Why did Delhi secure the highest overall score?
Delhi combined strong transport electrification with research, start-up and innovation capacity. Concentrated urban demand, fleet mandates and sustained policy support also strengthened its performance.
How does the index support India’s climate and energy goals?
It identifies state-level barriers that slow the shift from internal-combustion vehicles to electric mobility. Faster implementation can reduce transport emissions, oil dependence and urban air pollution while strengthening domestic clean-technology industries.
Related Current Affairs
Preparing for UPSC, PCS or HCS?
Talk to a mentor at Chetan Bharat Learning, Chandigarh. Free guidance on choosing the right exam and building a study plan.
Chat on WhatsAppCall 97793 53345UPSC / IAS / PCS coaching in Chandigarh · Trusted by aspirants across Punjab & Haryana
Leave a Reply
You must be logged in to post a comment.