

UPSC Mapping
| Prelims | NSO, PLFS, LFPR, WPR, UR and NEET |
|---|---|
| Mains | GS Paper III: Employment and Inclusive Growth |
| Released By | National Statistical Office |
|---|---|
| Survey | Periodic Labour Force Survey |
| Design Change | District stratum from 2025 |
| Core Measures | LFPR, WPR, UR and NEET |
Article
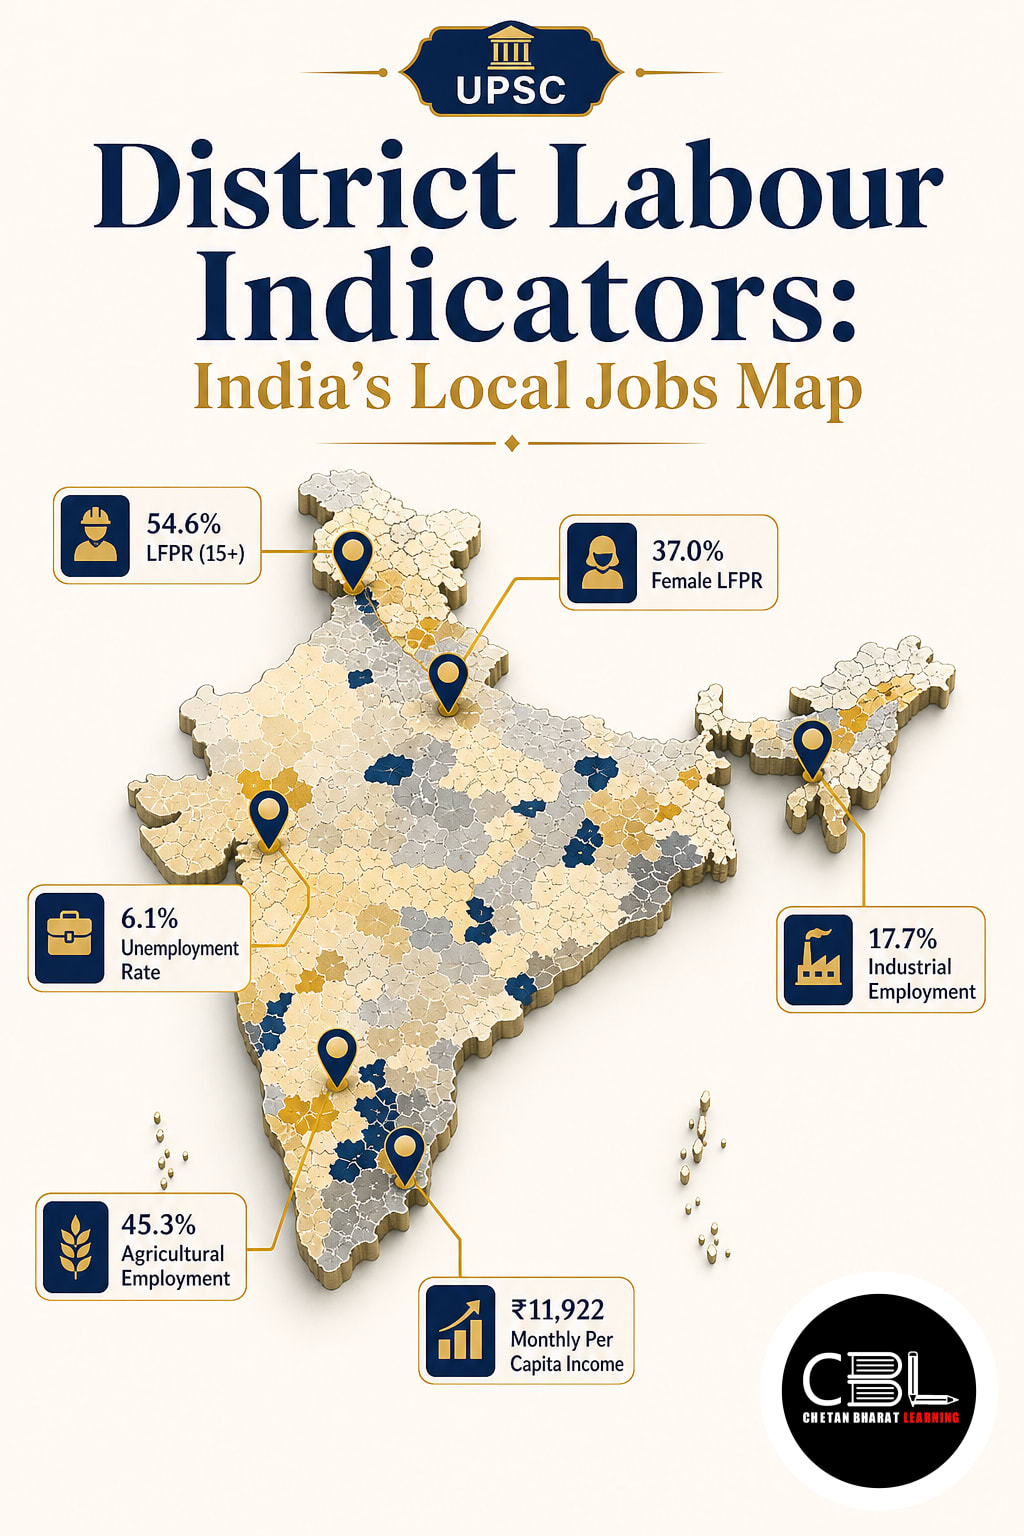
District Labour Indicators now provide India’s first detailed local employment picture through the redesigned Periodic Labour Force Survey. The new release helps administrators compare participation, employment, unemployment and youth disengagement across selected districts. Aspirants can connect these findings with inclusive growth, decentralised planning and India’s employment challenges through the daily current affairs archive.
What are District Labour Indicators?
District Labour Indicators describe employment conditions below the State level using four connected measures. The Labour Force Participation Rate measures people working, seeking work or available for work as a population share. The Worker Population Ratio measures employed people as a share of the population.
The Unemployment Rate measures unemployed jobseekers within the labour force, not within the total population. The youth NEET rate identifies people outside employment, education and training during the reference period. Analysts must read all four together because a low unemployment rate can coexist with weak participation. A person leaving the labour force may lower measured unemployment without securing productive work.
The snapshot uses the usual status approach, which considers activities over the preceding 365 days. It combines principal activity with eligible subsidiary economic activity to capture a broader annual work pattern. This approach differs from Current Weekly Status, which examines activity during the preceding seven days. The reference period therefore shapes interpretation, comparison and the policy question each estimate can answer.
Why are District Labour Indicators in News?
The National Statistical Office released District Labour Indicators for the first time on 18 September 2026. Its official labour market release covers selected districts under the redesigned Periodic Labour Force Survey. From 2025, the survey treats districts as the basic stratum across most geographical areas. Earlier designs used NSS regions and could not support representative district estimates specifically.
The release shows meaningful local variation behind national and State averages. Around 57.8% of districts recorded female LFPR of at least 40 per cent. About 76.2% reported youth NEET rates below 30 per cent, while 23.7% exceeded that level. Among the 100 most populous districts, Surat recorded the highest LFPR and WPR, while Darbhanga recorded the lowest. These rankings describe survey estimates and do not alone establish why districts perform differently.
The broader distribution also matters for exam analysis. Approximately 98.8% of district LFPR estimates and 98.3% of WPR estimates fell between 40 and 80 per cent. About 77.8% of districts recorded unemployment between 0.5 and 5.5 per cent. Such clustering still permits large differences in women’s participation, job quality, sectoral structure and youth transitions.
Key Features
The framework combines granular geography, standard definitions and complementary measures for local labour analysis.
- District-based sampling: NSO uses districts as the basic stratum across most areas, improving the basis for local estimates.
- Participation measure: LFPR captures workers and people seeking or available for work relative to the relevant population.
- Employment measure: WPR captures the employed population and indicates how widely economic work reaches local residents.
- Labour slack measure: UR identifies joblessness among labour-force participants, so analysts must interpret it alongside LFPR.
- Youth transition measure: NEET tracks people aged 15–29 outside employment, education and training during the reference period.
Together, these measures separate labour availability from actual employment and open unemployment. They also identify young people disconnected from both human-capital formation and workplace experience. District comparisons can guide local skilling, transport, childcare, industrial planning and employment services. Administrators can then align interventions with each area’s economic structure and demographic profile.
The framework also strengthens links between national goals and district implementation. State averages may conceal pockets of low participation or high youth disengagement. Local estimates help officials identify such pockets, compare similar districts and investigate administrative causes. Repeated releases could reveal whether targeted programmes change employment access across regions and social groups.
Challenges
District estimates improve visibility, but users must respect sampling limits, measurement choices and local context.
- Sampling variability: Smaller district samples can produce wider uncertainty, making Relative Standard Error essential for responsible comparison.
- Boundary changes: Estimates follow the sampling frame and may not reflect later bifurcations, renaming or boundary revisions.
- Limited comparability: Users should not directly compare district estimates with older NSS-region estimates built under another design.
- Informal work complexity: Multiple activities, seasonal work and unpaid family labour can complicate accurate employment classification.
- Quality blind spots: Headline ratios do not fully describe wages, security, hours, productivity, safety or social protection.
Rankings can encourage simplistic conclusions when confidence ranges overlap or local economies differ sharply. A high WPR may reflect strong formal employment, widespread self-employment or economic necessity. Likewise, a low UR may indicate job availability or weak job-seeking participation. Readers should combine survey ratios with wages, enterprise data, migration and sectoral composition.
Policy interpretation also requires gender-sensitive evidence on mobility, safety, unpaid care and workplace access. District dashboards should disaggregate outcomes without compromising respondent privacy or statistical reliability. Explore related themes in the Indian economy section, especially employment quality and inclusive growth. These dimensions prevent headline percentages from becoming substitutes for deeper labour-market diagnosis.
Way Forward
India should institutionalise regular District Labour Indicators with published uncertainty measures, metadata and stable comparison rules. NSO can expand user-friendly tables while protecting methodological consistency across successive survey rounds. District administrations should integrate the results with skill demand, enterprise registrations and social-security records. This combined evidence can support targeted apprenticeships, women’s employment services and local industry strategies.
MoSPI should also deepen consultations with States, researchers and data users on interpretation and access. Its PLFS data users conference highlighted granular statistics, larger samples and collaboration for evidence-based policy. Future releases should pair headline ratios with Relative Standard Errors, clear reference periods and downloadable district metadata. Transparent methods will improve accountability while discouraging misleading league tables.
Governments must convert measurement into coordinated local action rather than treat publication as the final objective. District skill committees, urban bodies and rural development agencies can jointly assess barriers facing women and youth. Independent evaluation should test whether interventions improve participation, stable work and earnings over time. This approach can advance decent work, balanced regional development and more credible employment governance.
Prelims Practice Corner
- Which institution released India’s first district-level key labour market estimates?
- (a) Labour Bureau
- (b) National Statistical Office
- (c) NITI Aayog
- (d) Finance Commission
Answer
(b) The National Statistical Office released the estimates under the redesigned PLFS.
- Labour Force Participation Rate measures which of the following?
- (a) Employed persons in the total population
- (b) Unemployed persons in the total population
- (c) Labour-force participants in the population
- (d) Formal workers in the labour force
Answer
(c) LFPR covers people working, seeking work or available for work as a population share.
- Consider the following statements about WPR: 1. It measures employed persons as a population share. 2. It measures unemployed persons within the labour force. Which is correct?
- (a) 1 only
- (b) 2 only
- (c) Both 1 and 2
- (d) Neither 1 nor 2
Answer
(a) WPR concerns employed persons, while UR measures unemployment within the labour force.
- In the district snapshot, NEET primarily refers to people outside which three activities?
- (a) Employment, education and training
- (b) Employment, elections and taxation
- (c) Enterprise, education and trade
- (d) Earnings, exports and tourism
Answer
(a) NEET means not in employment, education or training during the reference period.
- What major PLFS sampling change supported district-level estimates from 2025?
- (a) Villages became the national sampling unit
- (b) Districts became the basic stratum in most areas
- (c) Only urban households were surveyed
- (d) Census enumeration replaced sampling
Answer
(b) The redesign treated districts as the basic stratum across most geographical areas.
Mains Practice Questions
- How can district-level labour statistics improve employment policy and inclusive growth in India? (250 words, 15 marks)
Answer Structure
- Intro: Define granular labour statistics and mention the redesigned PLFS.
- Body: Cover local disparities, targeted skilling, women and youth, district planning, resource allocation, data convergence and methodological caution.
- Conclusion: Link reliable local evidence with accountable and employment-intensive development.
- A low unemployment rate does not necessarily indicate a healthy labour market. Discuss using LFPR, WPR and NEET. (150 words, 10 marks)
Answer Structure
- Intro: Explain that UR measures joblessness only among labour-force participants.
- Body: Contrast participation, employment and unemployment; add youth disengagement, informal work, gender barriers and job-quality limitations.
- Conclusion: Recommend a dashboard approach rather than reliance on one headline ratio.
FAQs
Why are district-level labour estimates important?
They reveal local disparities that State and national averages may conceal. Administrators can use them to design better skilling, transport, childcare and employment services.
How do LFPR and WPR differ?
LFPR includes workers plus people seeking or available for work. WPR includes only employed people as a share of the population.
Can the new estimates be compared directly with older PLFS data?
Users should avoid direct district comparisons with older NSS-region estimates. The sampling design, basic stratum and intended geographic representation changed from 2025.
Related Current Affairs
Preparing for UPSC, PCS or HCS?
Talk to a mentor at Chetan Bharat Learning, Chandigarh. Free guidance on choosing the right exam and building a study plan.
Chat on WhatsAppCall 97793 53345UPSC / IAS / PCS coaching in Chandigarh · Trusted by aspirants across Punjab & Haryana
Leave a Reply
You must be logged in to post a comment.